Data hub for energy efficiency, production optimization and quality assurance
Pure consumption is not the decisive factor for operational energy management. This is because it is directly related to production, floor space or other variables. It is therefore important to integrate data from devices, machines and systems into the energy management solution. The easiest way to do this is with hardware-independent systems. Software interfaces also offer advantages over hardware solutions.
For manufacturing companies, the key figure for energy management is usually the energy consumption per part, batch or tonne produced. The consumption of a process or area in relation to the total energy consumption or the energy costs in relation to the production costs can also be useful key figures. Sometimes other dependencies are added, e.g. temperature, humidity or similar. For office buildings or warehouses, the relevant parameter is often the amount of heat consumed per square meter depending on the outside temperature.
Devices and systems from different manufacturers
Most of the necessary data is already available in the companies, but in different systems and devices from different manufacturers.
The simplest method of transferring them to the energy management system is by means of csv, txt or xsl files. This allows, for example, time-stamped quantities to be transferred collectively at regular intervals.
The disadvantage of this variant compared to a direct connection of the corresponding devices and systems: The data is not available continuously. An evaluation virtually in real time, such as an alarm when threshold values are reached, is only possible with a time delay resulting from the import interval.
To do this, the machines, devices and systems must be linked to the energy management system. The biggest challenge here lies in the large number of existing protocols. This is because the infrastructure in companies has usually grown over many years and there are numerous machines, devices and systems from different manufacturers.
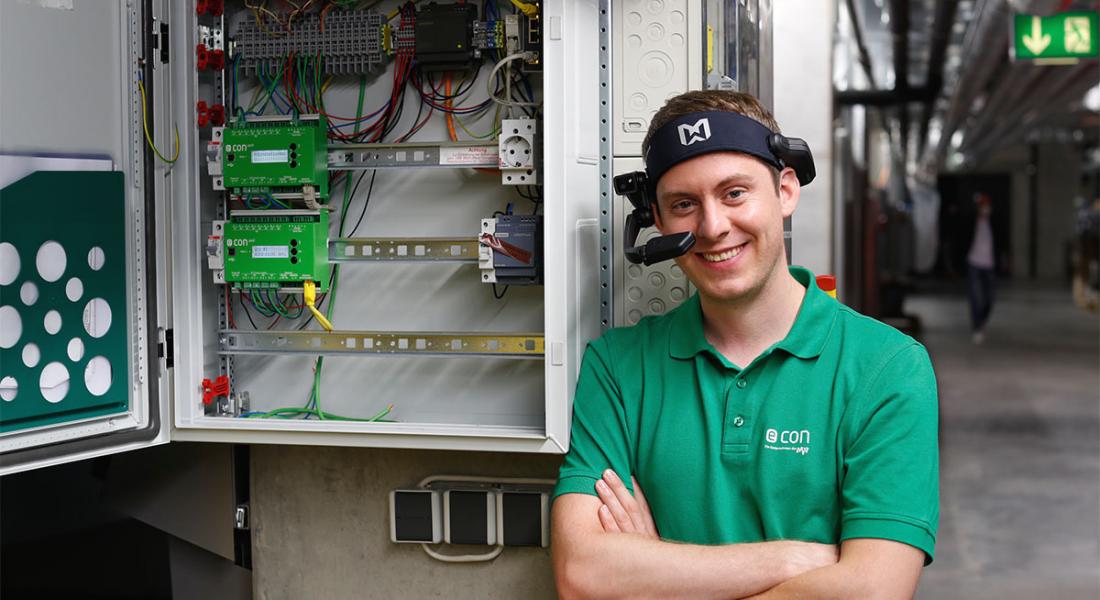
Measuring devices and sensors for recording heat, water, gas or electricity quantities usually use Modbus or M-Bus. A data logger can be used to integrate their measured values into the energy management system. It acts as a buffer and connector. The econ unit+ V2 data logger from econ solutions has all common interfaces (S0 pulse, M-Bus, Modbus, digital and analog signals). It can be integrated into any existing infrastructure, including a BACnet/IP or Modbus TCP network.
These measuring devices and sensors are often already integrated into a building management system (BMS) or plant or machine data acquisition system (PDA/MDA). These are based on either the OPC (OPC UA) or BACnet protocol. In order to integrate the relevant data from these systems into the energy management system, appropriate servers and interfaces are required. Setting them up and parameterizing them requires a relatively high level of programming effort and knowledge of programming languages. Many companies therefore rely on service providers for this.
Software interfaces simplify parameterization
econ solutions takes a different approach: with econ connect, the energy management specialist offers a tool with which companies can connect devices and systems themselves without IT knowledge and with manageable effort. The interfaces for the values and data points to be transferred are set up via a table assignment using a graphical interface with user guidance. A monitoring function reports if data does not arrive in the system or does not arrive correctly.
econ connect covers all common software-based interfaces (OPC DA/UA, BACnet, Modbus TCP and Modbus RTU). In addition, econ connect supports the import of file attachments sent by e-mail (MSCONS, csv, txt) as well as the direct integration of the econ sens energy and power meter via the IP address. In addition, csv, API, MSCONS, Wago and thus KNX, Profibus, LON and other interfaces can also be connected to the econ system. If required, econ solutions can also integrate proprietary protocols after checking with the manufacturer. All interfaces can be combined as required.
Data becomes images and insights
The agricultural machinery company Fendt has connected its building management system and the "Fendt View" plant technology to the energy management system via OPC and BACnet using the econ connect software interfaces. Among other things, the temperature of systems and outside air, humidity, volume flows, lighting times and control signals are transferred from the conveyor belt to the econ4 energy management software. It uses this and the values from other measuring devices to generate the key figure for Fendt, the energy consumption per tractor produced, as well as numerous evaluations. On this basis, Fendt was able to significantly reduce consumption per tractor through a series of targeted efficiency measures.
The Merz laundry in Wurmberg near Pforzheim combines the energy data with quantities and weight of the laundry items as well as throughput times and speeds from light barriers, CPU, power terminals and electricity meters from Wago. Further key performance indicators flow in from the Tikos ERP software from Socom, which Merz was already using. The resulting analyses enable Merz to track energy, gas and water consumption in detail, avoid peak power loads and rectify damage to machines at an early stage. It also provides a sound basis for calculating individual textiles or orders.
At the Dinkelacker-Schwabenbräu brewery, the energy management system also serves as a basis for investment decisions: The Head of Maintenance and Energy has developed mathematical models from the characteristic curves of the compressors, which he can use to run through different scenarios for various new compressor models and evaluate them in monetary terms.
Ensinger Mineral-Heilquellen has not only used the solution to analyze and reduce energy consumption per 1.000 filled bottles, but also uses this indicator to detect machine defects at an early stage, which previously went undetected for a long time and led to increased consumption. Ensinger also feeds data from sensors on various machines into the energy management system, such as the pH value, conductivity and temperature. The econ4 software uses this data to generate graphs, which the production managers receive on their computers every day. "Although this no longer has anything to do with energy management, the measuring devices can be integrated so easily and the production managers can see immediately if something is getting out of hand," explains Siegfried Winkler, Technical Manager and Energy Officer at Ensinger.