Key figures in energy management

A key figure is generally used to present complex business issues in a condensed, quantified form. On the one hand, this makes actual conditions and processes measurable, and on the other hand, it makes correlations recognizable. Key figures that are collected and analyzed over a longer period of time also provide a basis for defining specific goals and target states. Energy performance indicators (EnPI) are becoming increasingly important, especially in energy-intensive industries. Topics such as "environmental protection", "CO2 reduction" and "sustainability" are becoming increasingly relevant. In view of this development, the importance of energy management is also increasing for companies, with the aim of using and saving resources as efficiently as possible. Measuring a company's energy consumption is directly linked to the introduction of certain energy management systems such as ISO 50001. Information on a company's energy consumption alone is no longer sufficient; ISO 50001 requires the establishment of energy performance indicators. It can therefore be assumed that the trend will continue, particularly in companies with large energy requirements.
Drawing up and analyzing energy performance indicators enables companies to monitor their activities, demonstrate success and draw comparisons. A wealth of data also becomes a manageable amount of information that is well suited for internal information transfer and external communication, among other things. Practical experience shows that improvement and energy efficiency are easier to achieve with measurable and meaningful energy indicators. Even if the key figures alone do not save energy, they are a helpful starting point for optimizing energy systems by objectifying and visualizing energy targets. Energy performance indicators can therefore be seen as a tool: on the one hand to uncover optimization potential and derive appropriate measures from this, and on the other hand to provide a measurable record of improvements achieved.
Naturally, industries and companies differ in terms of the key (energy) indicators that are most important to them. The key figures are generated from a wide variety of energy data from different systems, including data from energy monitoring, production data and data from ERP systems, for example. An energy KPI usually comprises the input and output variables of a process or company. Generally important key figures in energy management include
- Energy consumption per machine: how much energy do individual machines consume? Could it possibly be worth increasing the production of one machine in order to use a more energy-intensive machine less?
- The share of energy costs in the company's total costs: How much do energy costs make up of the total costs incurred? Are they possibly far too high?
- Energy consumption per output or per unit produced: How much energy is required to produce a unit?
In principle, key figures can appear in absolute or relative form. While an absolute key figure, for example, shows the total energy consumption of a company, a meaningful relative key figure is able to assess the company's energy performance independently of absolute fluctuations in consumption. This makes it possible, for example, to show the efficiency of a company's energy efficiency measures. If you want to determine which business activity has significant energy consumption, an absolute key figure is suitable. If, on the other hand, the relationship between two reference values (absolute key figures) is to be considered, relative key figures are used. Both absolute and relative key figures can provide relevant information. However, the first figure shows that some key figures are initially unusable or not immediately clear in their preparation, for example because they are broken down too roughly, show inexplicable fluctuations or relevant variables are not taken into account.
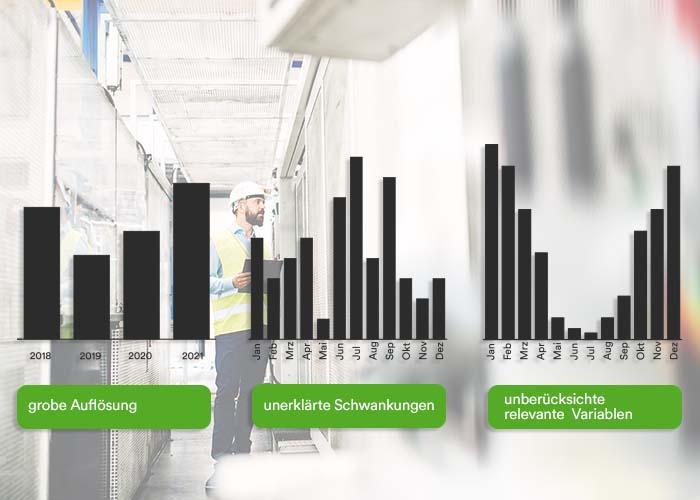
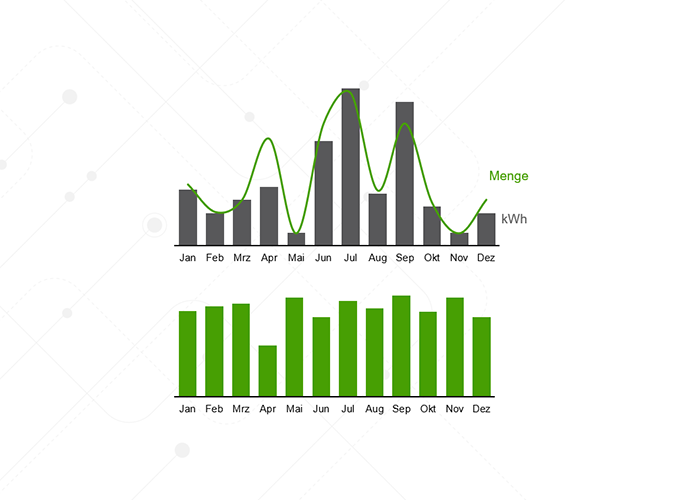
In this case, a deeper analysis - e.g. with relative key figures - is necessary to get to the bottom of the meaning of the figures. In production, for example, the assumption is that the more energy is required, the more is produced. It would therefore be advisable here to include a ratio, e.g. kWh/t, instead of looking at consumption alone - the key figure is smoothed and becomes more meaningful. This can be seen in the figure below.
In summary, key performance indicators are an excellent tool for control, prioritization and optimization - and with econ they can always be configured and displayed easily and free of charge. The fourth generation of our energy management software is currently one of the leading solutions for operational energy management. Regardless of the data source and manufacturer when connecting hardware (e.g. electricity meters), the data points can be easily and quickly combined into various key figures. The key figure editor in econ4 can be used to generate all types of calculations. With just a few clicks, Energy Performance Indicators or virtual measuring points can be created, which can be evaluated directly in the reporting system. Hand in hand with our sister company BFE, we can also offer consulting services! The consulting components of an all-round package include, for example, the analysis of existing key performance indicators (KPIs) and energy performance indicators, the joint development of suitable key figures for your company and the ongoing identification of savings potential based on the system.