Reports guide: The load profile report or standard load profile
The fourth generation of the econ4 energy management system is currently one of the leading solutions for operational energy management. Among other things, econ4 enables comprehensive graphical processing of your energy consumption in the form of user-specific dashboards. This short guide takes a closer look atthe standard reports.
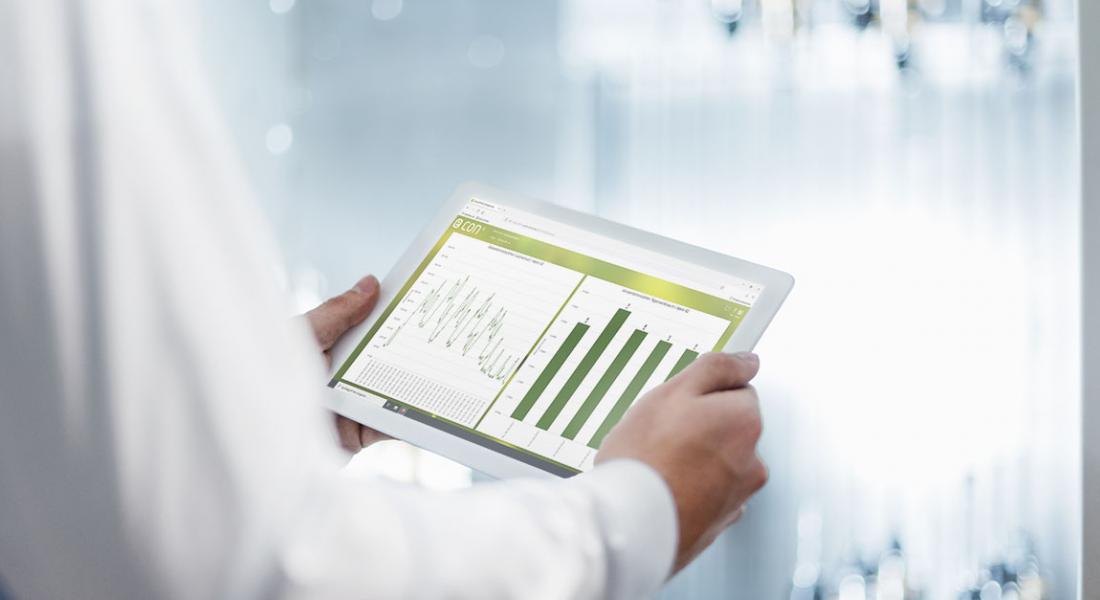
The econ4 standard reports enable a flexible compilation of load profile data, time comparisons for before and after analyses and dynamically sequential visualization options. Any measuring points, even those with different units, can be combined with each other. With the included mouse-over function, the measured values can be displayed along the measurement curve by simply moving the mouse over them. The standard reports include bar and line charts.
📈 The line graph shows a status or performance over time. This makes it immediately visible how the power consumption or output or other variables have developed. Patterns become recognizable.
The time window for the display can be freely selected, including the 15-minute cycle analogous to the cycle of the energy suppliers. This makes it possible to compare different quarter-hour load profiles. In addition, load peaks can be identified and operating behavior such as night-time reduction potential due to standby can be analyzed.
📊 The bar chart shows the cumulative quantities during a specific period. You can choose between hour, day, week, month or year.
A second period can be displayed for comparisons, e.g. before and after analyses following the implementation of an efficiency measure. A second Y-axis can be added to identify dependencies. A plausibility check of the measuring devices can also be carried out wonderfully with the help of the stacked bar display.