
Key figures, threshold values & deviations
Create individual calculations and comply with limit values
Your advantages at a glance
- Simple creation of Energy Performance Indicators (EnPI)
- Calculation and distribution of quantities/values to e.g. cost centers
- Determination of operating hours based on the load profile
- Notification/alarm in the event of non-compliance with threshold values or deviations between two time ranges
Key figures and virtual measuring points are created quickly and easily with the key figure editor and are immediately available for evaluation. The threshold value and deviation function ensures that nothing gets out of hand.
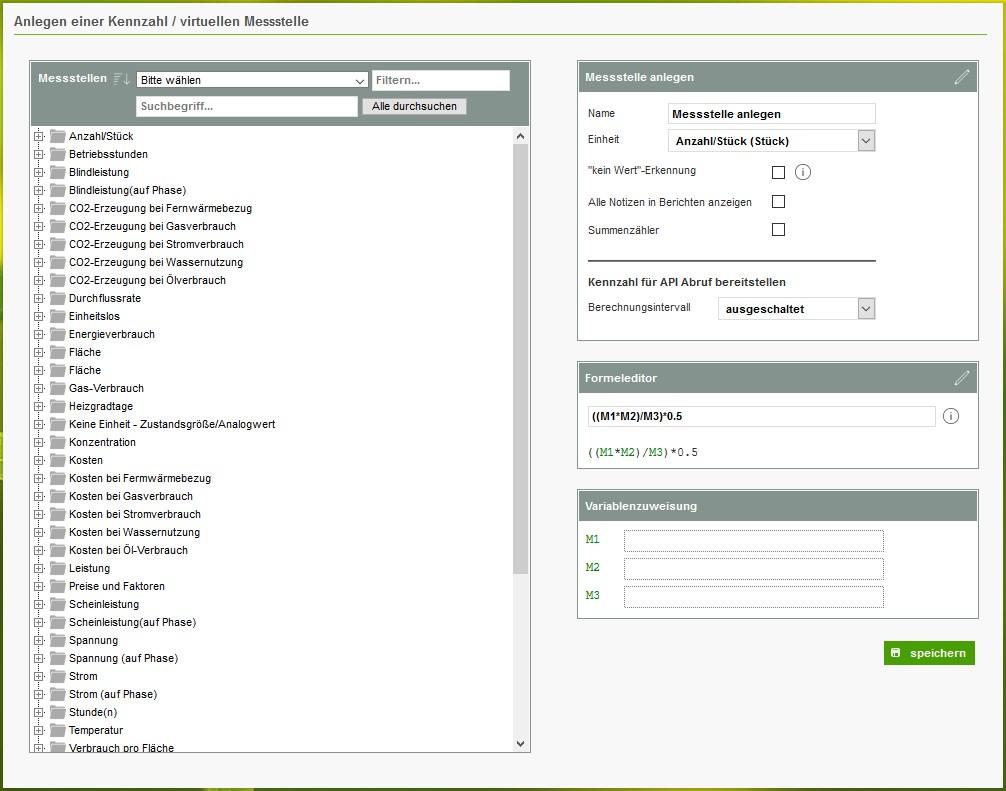
ISO 50001 requires Energy Performance Indicators, or EnPIs for short. This means that the mere consumption of energy is not sufficient, but that a performance indicator must be formed. This usually comprises the input and output variables of a process or company. The input variables here are the energy input, while the output variables are, for example, quantities, unit numbers or tonnages.
The key figure editor in econ4 can be used to generate all conceivable variants of calculations. In addition to the basic arithmetic operations, logical functions are also available as functions in the formulas. In addition to the EnPI, allocations for cost center distributions can of course also be generated.
Threshold values can be defined for measuring points. As soon as the value falls below the lower threshold or exceeds the upper threshold, a notification is sent.
The deviation function compares time periods with integrated display of deviations/changes in absolute and relative terms (in %). The evaluation takes place automatically at individually adjustable intervals.
Key figures, threshold values & deviations
Bildung von Kennzahlen und virtuellen Messstellen, einfach und flexibel editierbar:
- Flexibler und mächtiger Formeleditor zur Erstellung einfacher und komplexer Formeln
- Berücksichtigung der Grundrechenarten, von Klammerausdrücken sowie logischen Verknüpfungen
- Kombination beliebiger Werte im econ System wie Messdaten, manuelle Zählerstände oder erfasste Konstanten sowie Zeitschablonen
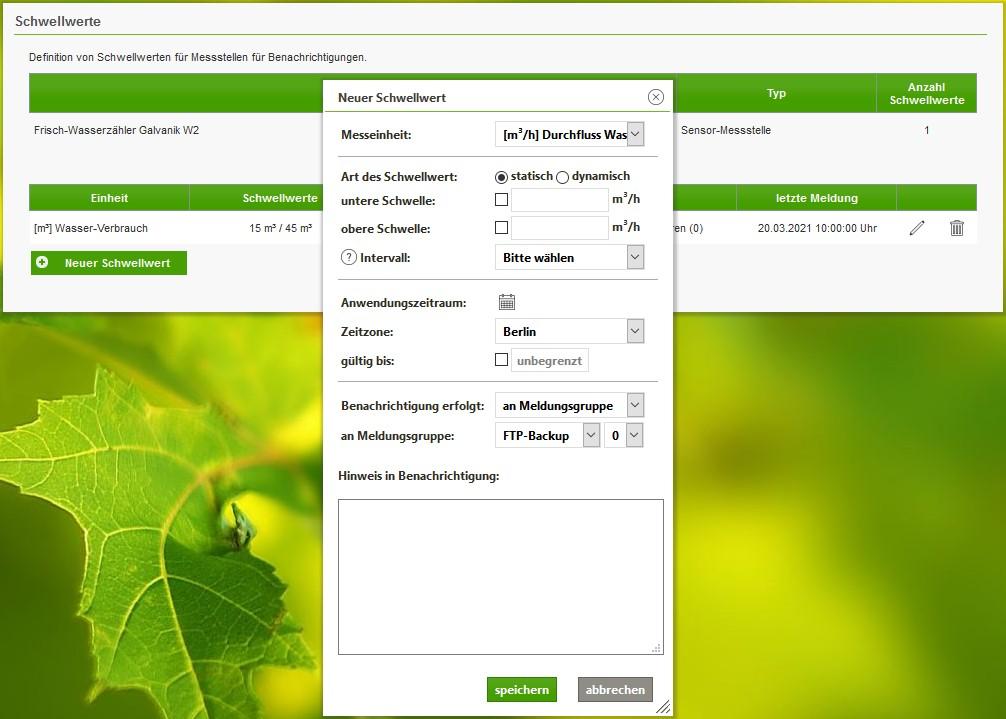
Definition von Schwellwerten und Benachrichtigungen für einzelne Messstellen:
- Schwellwertüberwachung für Messwerte, z.B. zur Rohrbruchwarnung
- Schwellwertüberwachung für Kennzahlen, z.B. bei Verschlechterung des Wirkungsgrads
- Frühwarnsystem durch automatische Meldung per E-Mail, SMS
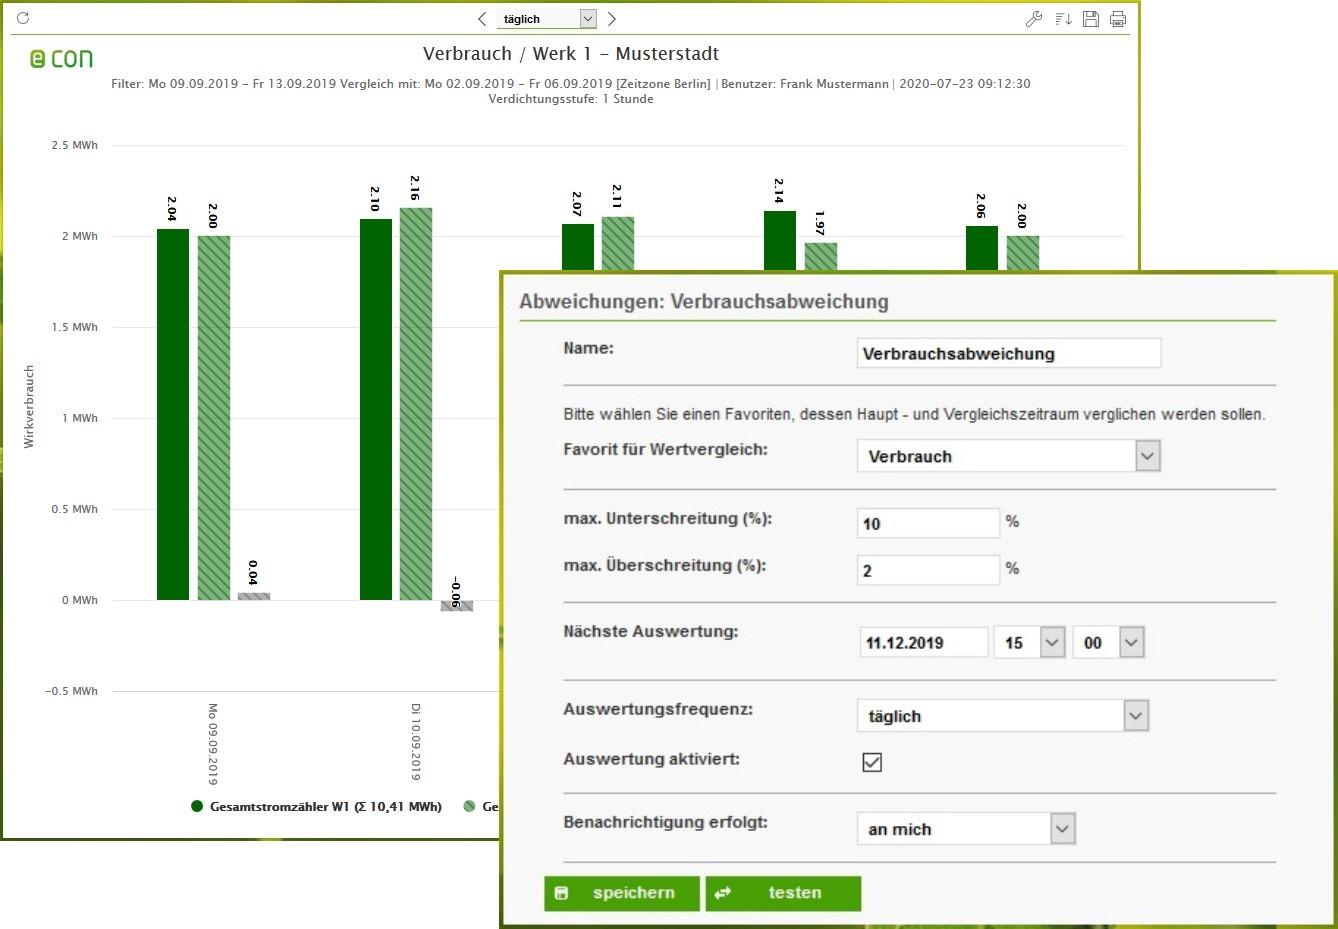
Abweichungsanalyse mit automatischer Überwachung von Grenzwerten:
- Vergleich von Zeiträumen mit integrierter Darstellung der Abweichungen/ Veränderungen absolut und relativ (in %)
- Die Verbräuche von zwei unterschiedlichen Zeitbereichen können durch Eingabe einer Ober- und Untergrenze in % miteinander verglichen werden.
- Die Auswertung erfolgt automatisch in individuell einstellbaren Zeitabständen und wird per E-Mail an den User oder eine definierte Meldegruppe versendet