Standard reports
Analysis and evaluation using graphical report types
Your advantages at a glance
- Flexible compilation of load profile data, mouse-over function
- Time comparisons for before and after analyses, dynamic visualization options
- Combination of any measuring points, even with different units
- Evaluation of the 15-minute power averages analogous to the timing of the energy suppliers
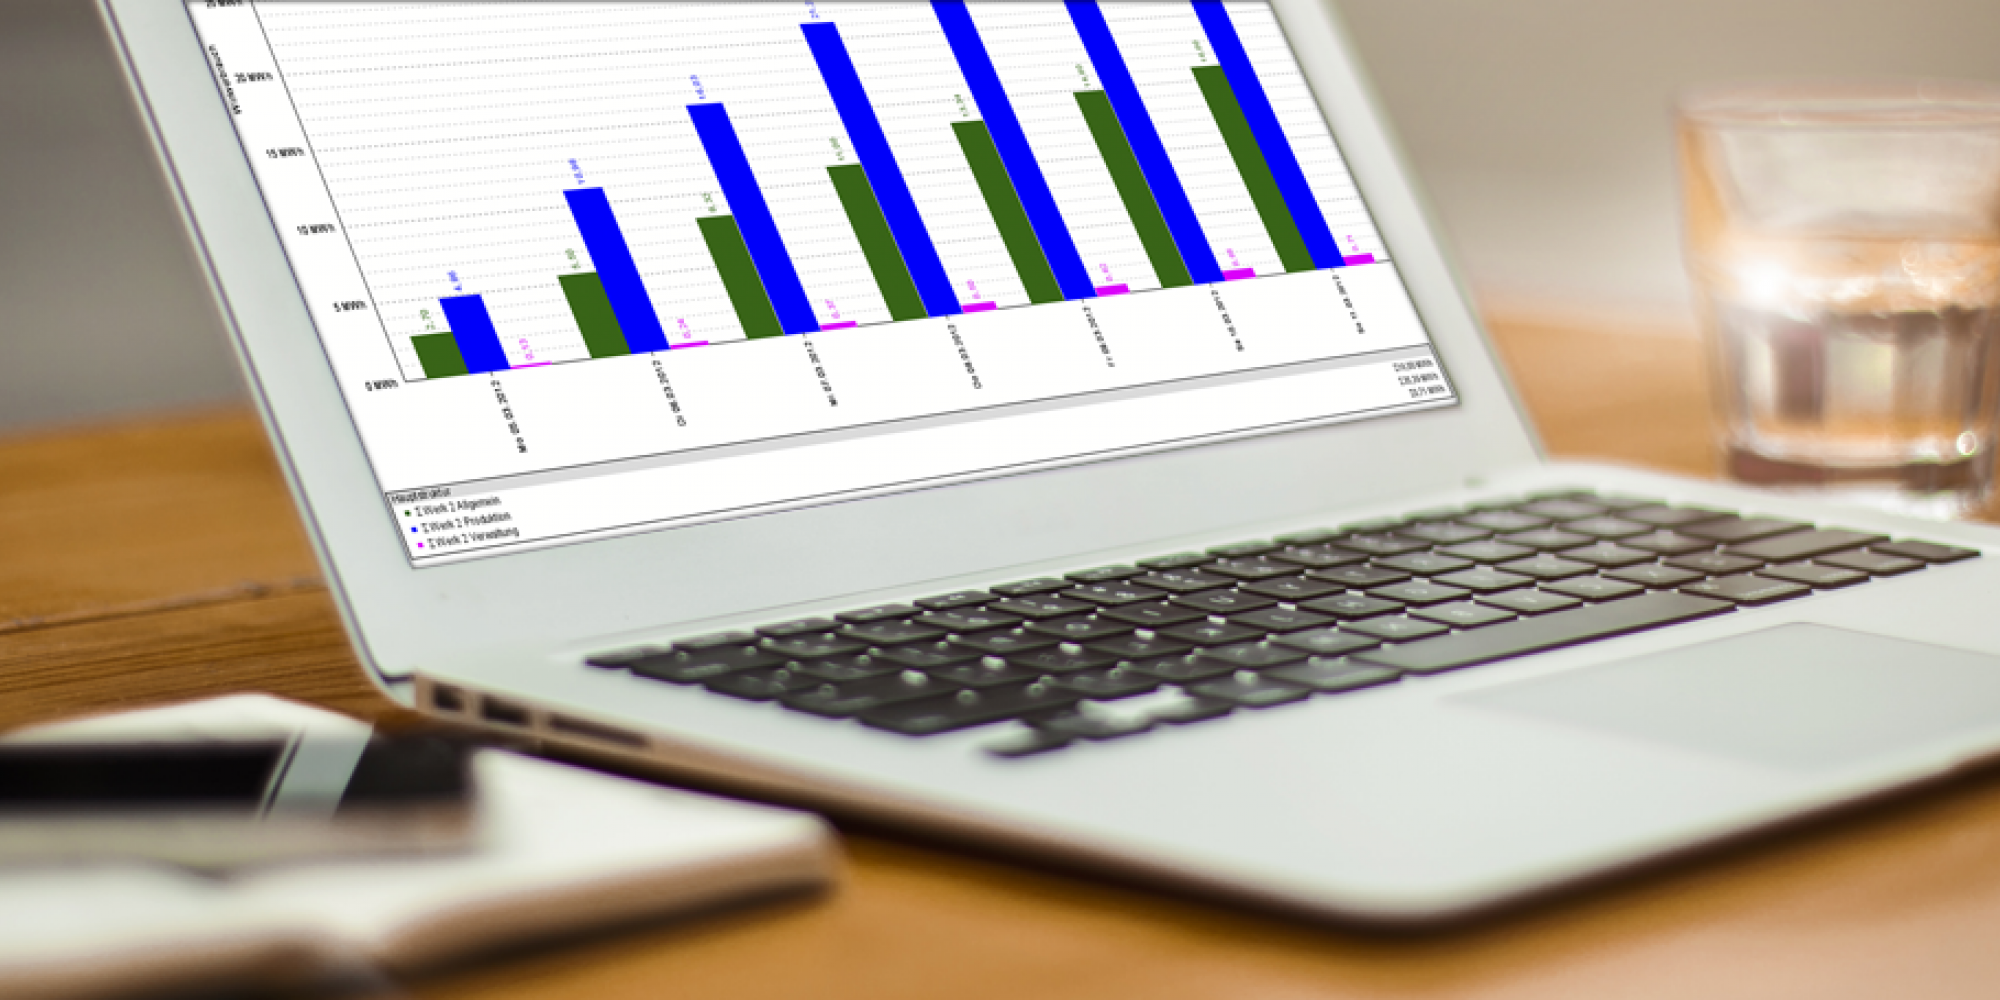
The econ4 standard reports include bar and line charts for standardized and familiar representations. Comparison periods can be added at any time. All relevant measuring points are available in one report.
The line diagram is the best-known type of representation for a load profile or temperature curve. The load profile can be compared with reference periods at any time. The time window for the display can always be freely selected. The focus is on the display of status values and their development over time. The bar chart shows the cumulative quantities over time. Fixed time grids such as hour, day, week, month or year as well as the total can be selected here. The report options can be used to change the report displays individually in order to optimize the informative value.
Standard analyses & evaluations
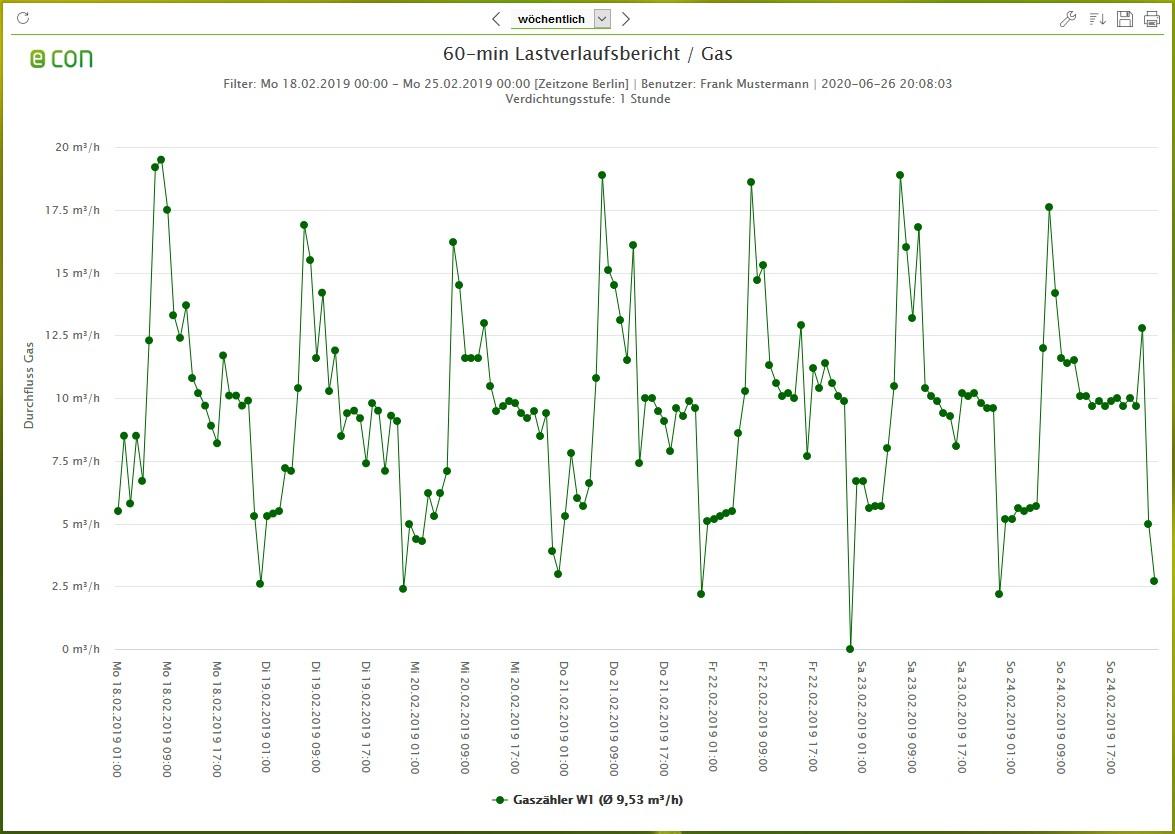
Liniendiagramm zur Darstellung eines Zustands oder einer Leistung über die Zeit:
- zeitlicher Verlauf der Zustandsgrößen (Temperatur, Leistungsaufnahme/-abgabe usw.) auf einen Blick Vergleichszeitraum jederzeit zuschaltbar
- 15-Minuten Darstellung für den EVU-Lastgang Strom
- optionale zweite Y-Achse zur Identifikation von Abhängigkeiten
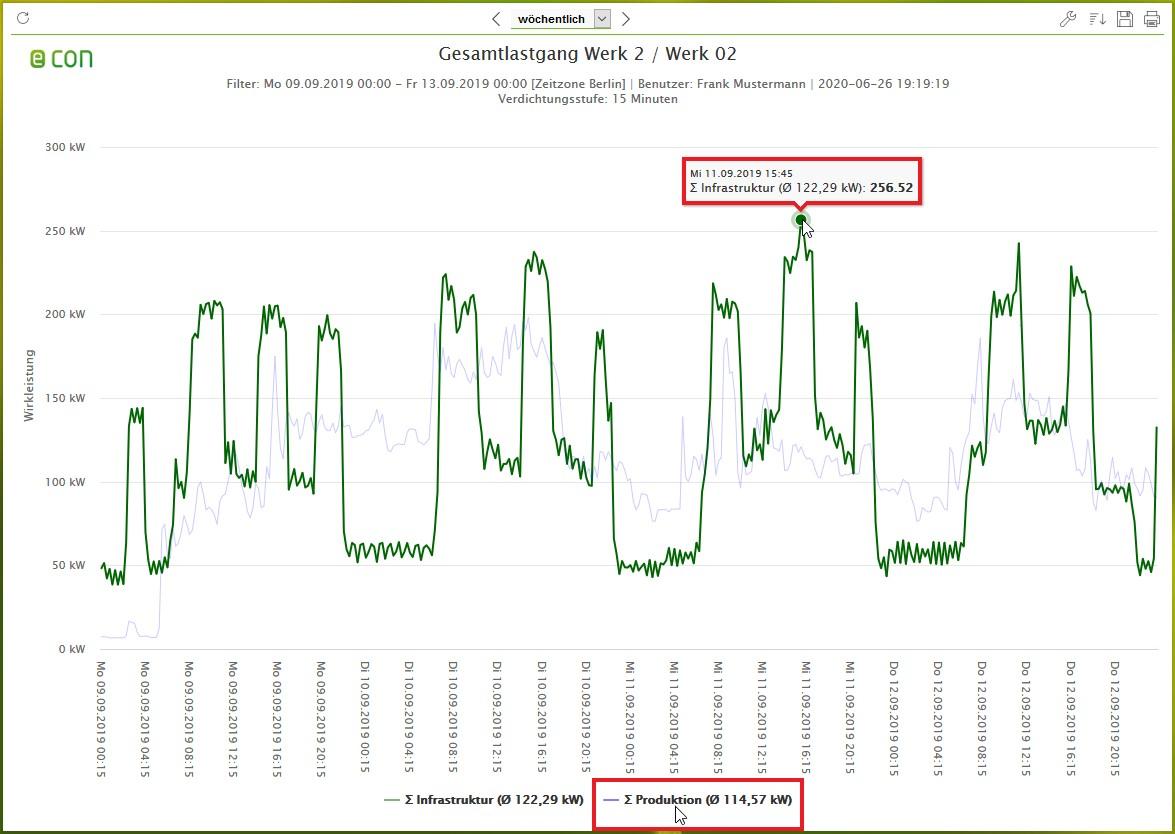
Liniendiagramm mit Mouse-Over Funktion und Messkurvenabwahl:
- Mit der Mouse-Over Funktion lassen sich Messwerte entlang der Messkurven anzeigen
- Zur besseren Übersichtlichkeit lassen sich in der Legende einzelne Messkurven ab- und zuschalten
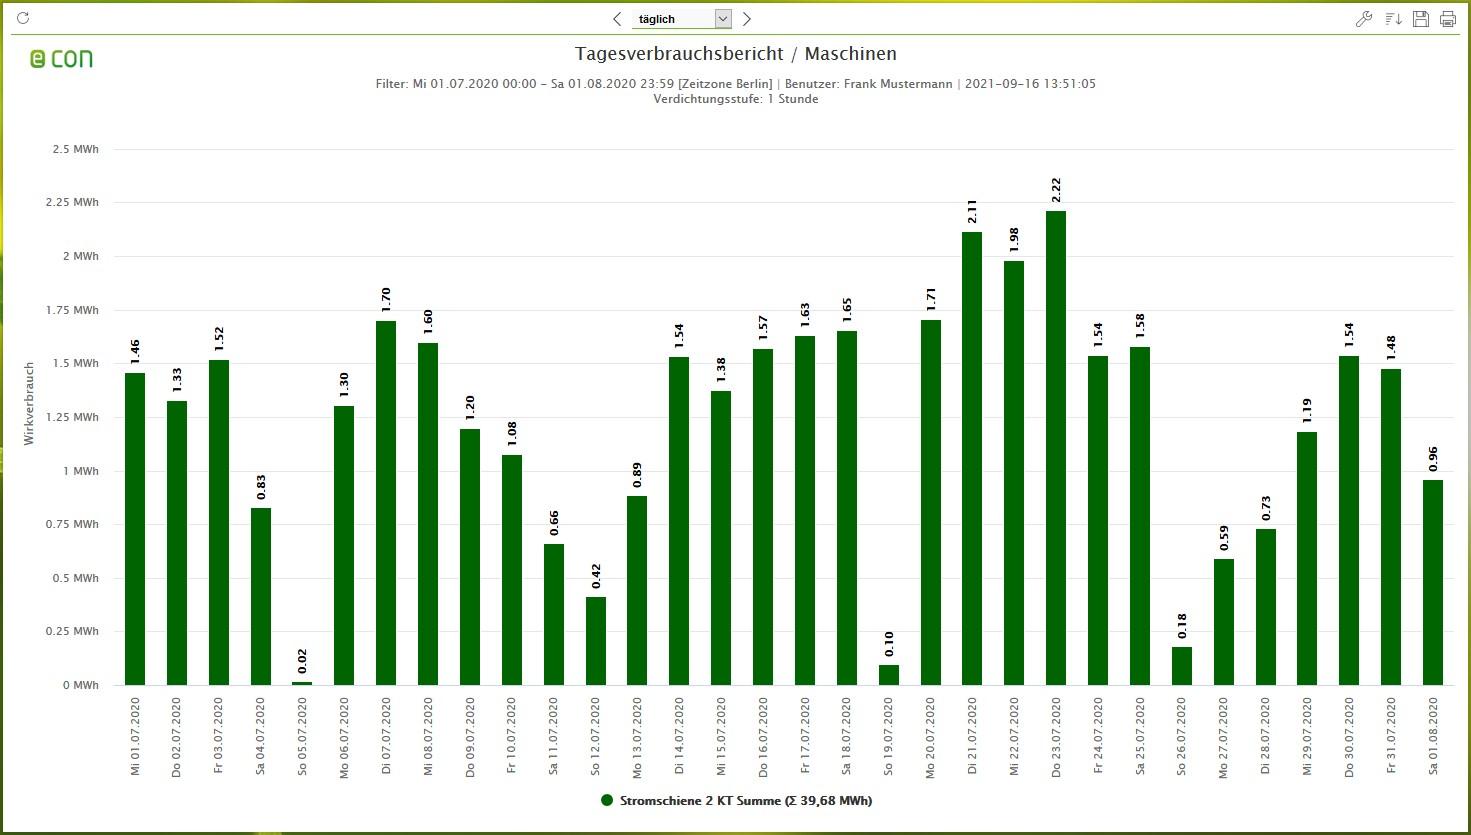
Säulendiagramm der Tagesverbräuche:
- Zeitraum für Summenbildung flexibel wählbar für Stunden-, Tages-, Wochen- oder Monatsebene sowie individuell
- Darstellungsoptionen für gestapelte und kumulierte Darstellung
- Vergleichszeitraum jederzeit zuschaltbar